📈 Understanding Training Results
Once your training job completes, a rich set of metrics and visualizations will be available. This page explains what they mean and how to act on them.1. Performance Metrics
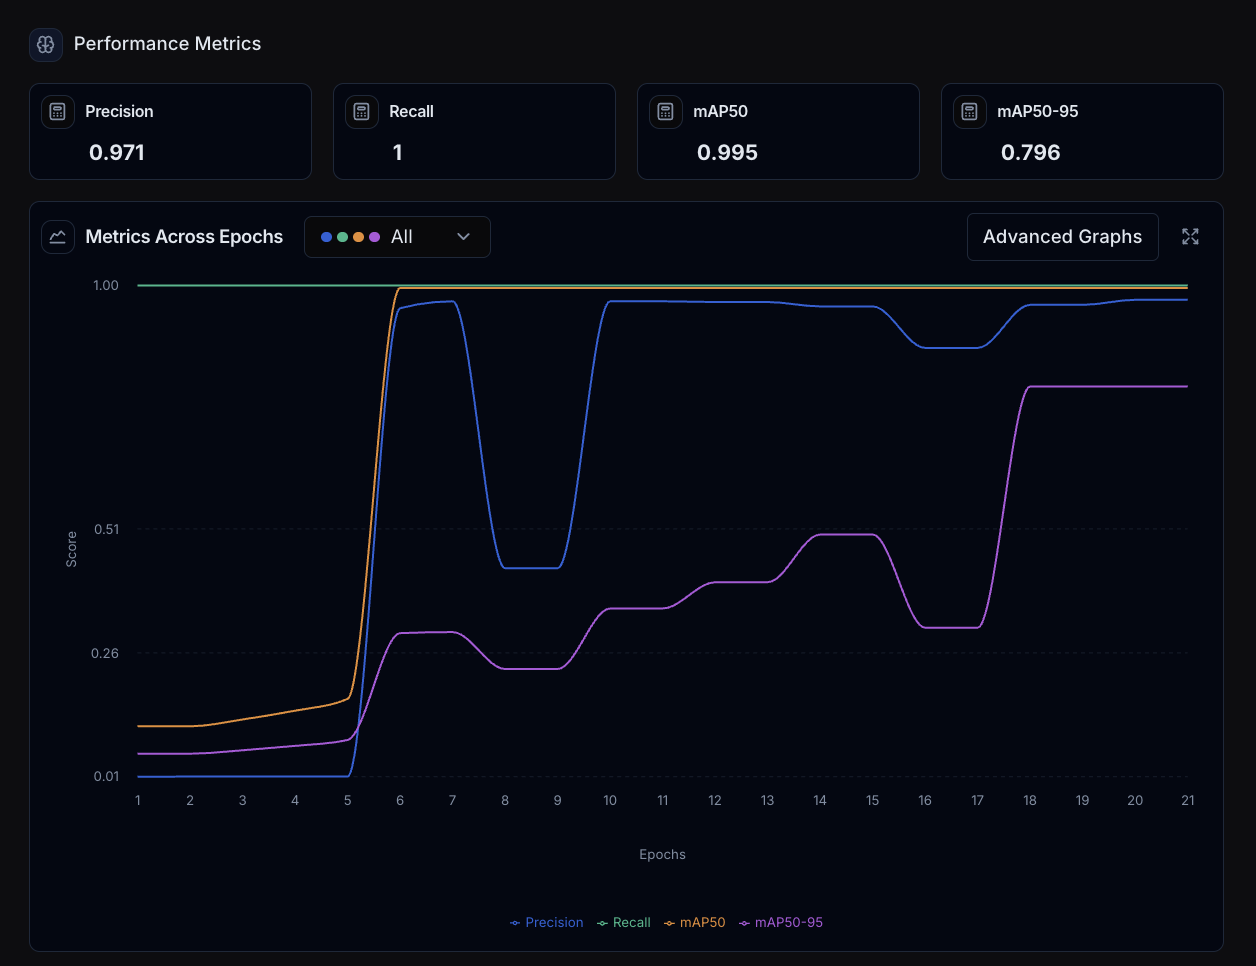
Metrics Across Epochs
Look for curves that rise then plateau—an indicator that learning has stabilized. Sharp drops or spikes often mean an overly aggressive learning rate.2. Training & Validation Loss
Loss is the raw error signal the model is trying to minimise.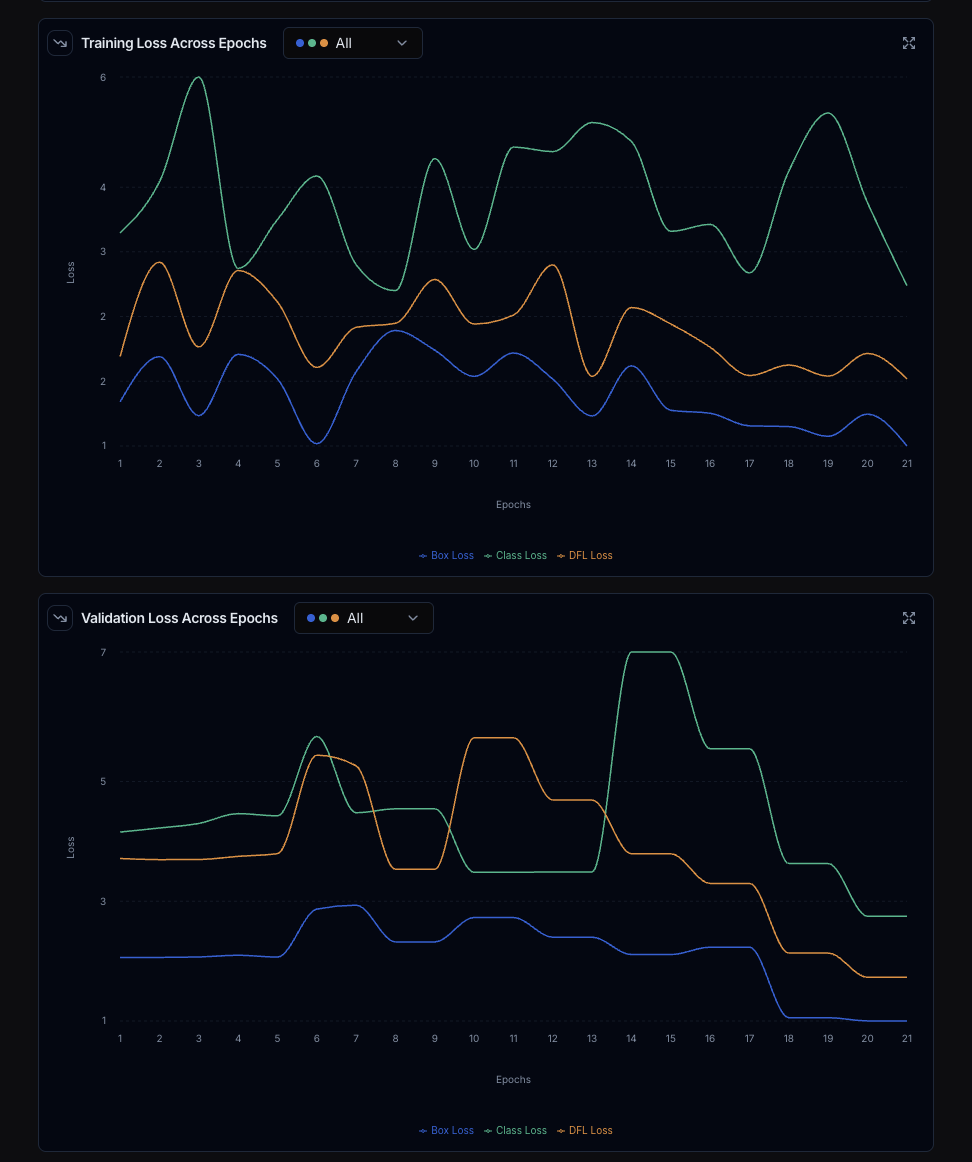
- Training Loss should trend downwards steadily.
- Validation Loss should track the training curve. If it diverges upward your model is over-fitting.
3. Confusion Matrix
Rows = actual class, columns = predicted class. Diagonal cells are correct predictions; off-diagonal cells highlight confusions.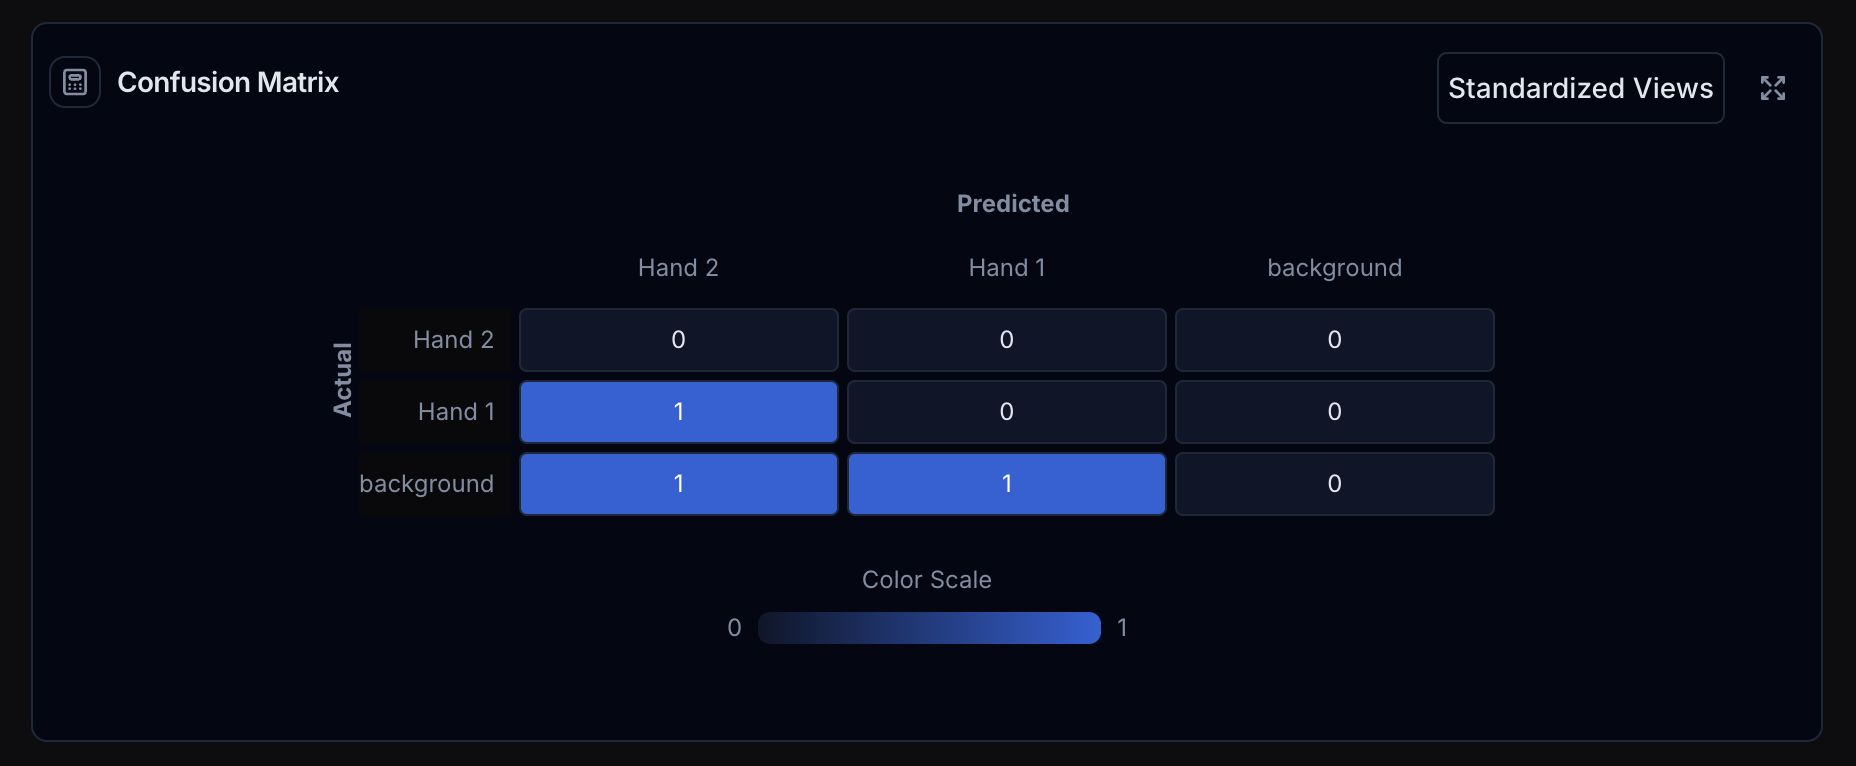
Hover a cell to reveal exact counts and click to view example frames in
context.
🛠️ Troubleshooting Checklist
FAQ
Why is mAP50 high but mAP50-95 low?Boxes are in the right area but not tight. Try using more epochs. Why are there many background → class errors?
Add more pure background frames to train with When should I stop training?
When
val/mAP50 flattens or Early-stopping triggers after patience epochs.
Happy with the metrics? Download or deploy your model. Otherwise tweak settings
in the Training page and try again.