> ## Documentation Index
> Fetch the complete documentation index at: https://docs.useocular.com/llms.txt
> Use this file to discover all available pages before exploring further.
# Model Evaluation
> Interpret metrics, graphs, and confusion matrices to judge model performance.
# 📈 Understanding Training Results
Once your training job completes, a rich set of metrics and visualizations will be available.
This page explains what they mean and how to act on them.
## 1. Performance Metrics
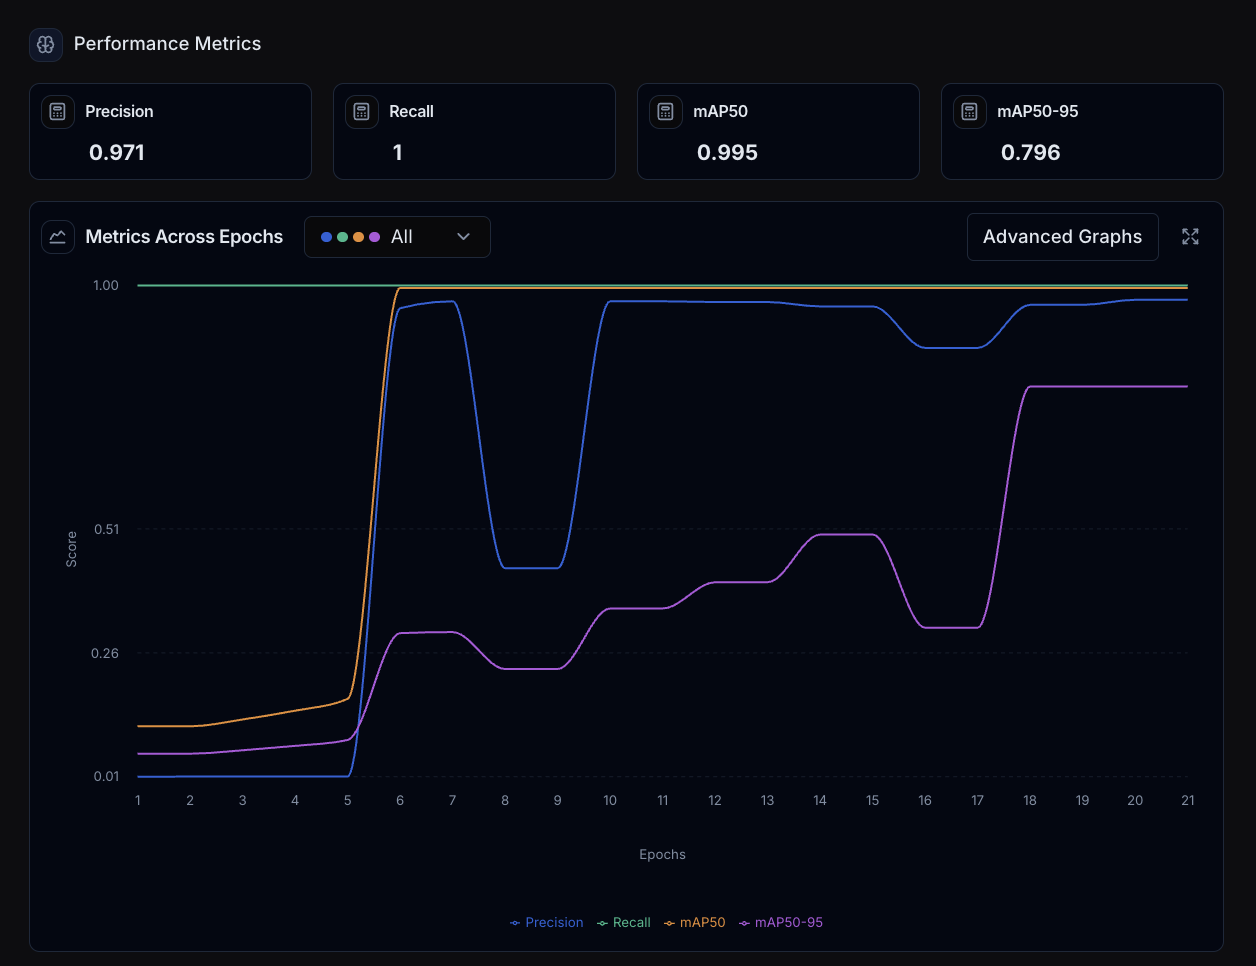 | Metric | Question it answers | Good value |
| ------------- | ----------------------------------------- | ---------- |
| **Precision** | How many predicted boxes are correct? | >0.9 |
| **Recall** | How many ground-truth objects were found? | >0.9 |
| **mAP50** | Average precision @ IoU 0.50 | 0.85–0.95 |
| **mAP50-95** | mAP averaged over 0.50–0.95 IoU | 0.45–0.65 |
`mAP50` is a high-level accuracy gauge, while `mAP50-95` evaluates box
tightness.
### Metrics Across Epochs
Look for curves that rise then plateau—an indicator that learning has
stabilized. Sharp drops or spikes often mean an overly aggressive learning
rate.
## 2. Training & Validation Loss
Loss is the raw error signal the model is trying to minimise.
| Metric | Question it answers | Good value |
| ------------- | ----------------------------------------- | ---------- |
| **Precision** | How many predicted boxes are correct? | >0.9 |
| **Recall** | How many ground-truth objects were found? | >0.9 |
| **mAP50** | Average precision @ IoU 0.50 | 0.85–0.95 |
| **mAP50-95** | mAP averaged over 0.50–0.95 IoU | 0.45–0.65 |
`mAP50` is a high-level accuracy gauge, while `mAP50-95` evaluates box
tightness.
### Metrics Across Epochs
Look for curves that rise then plateau—an indicator that learning has
stabilized. Sharp drops or spikes often mean an overly aggressive learning
rate.
## 2. Training & Validation Loss
Loss is the raw error signal the model is trying to minimise.
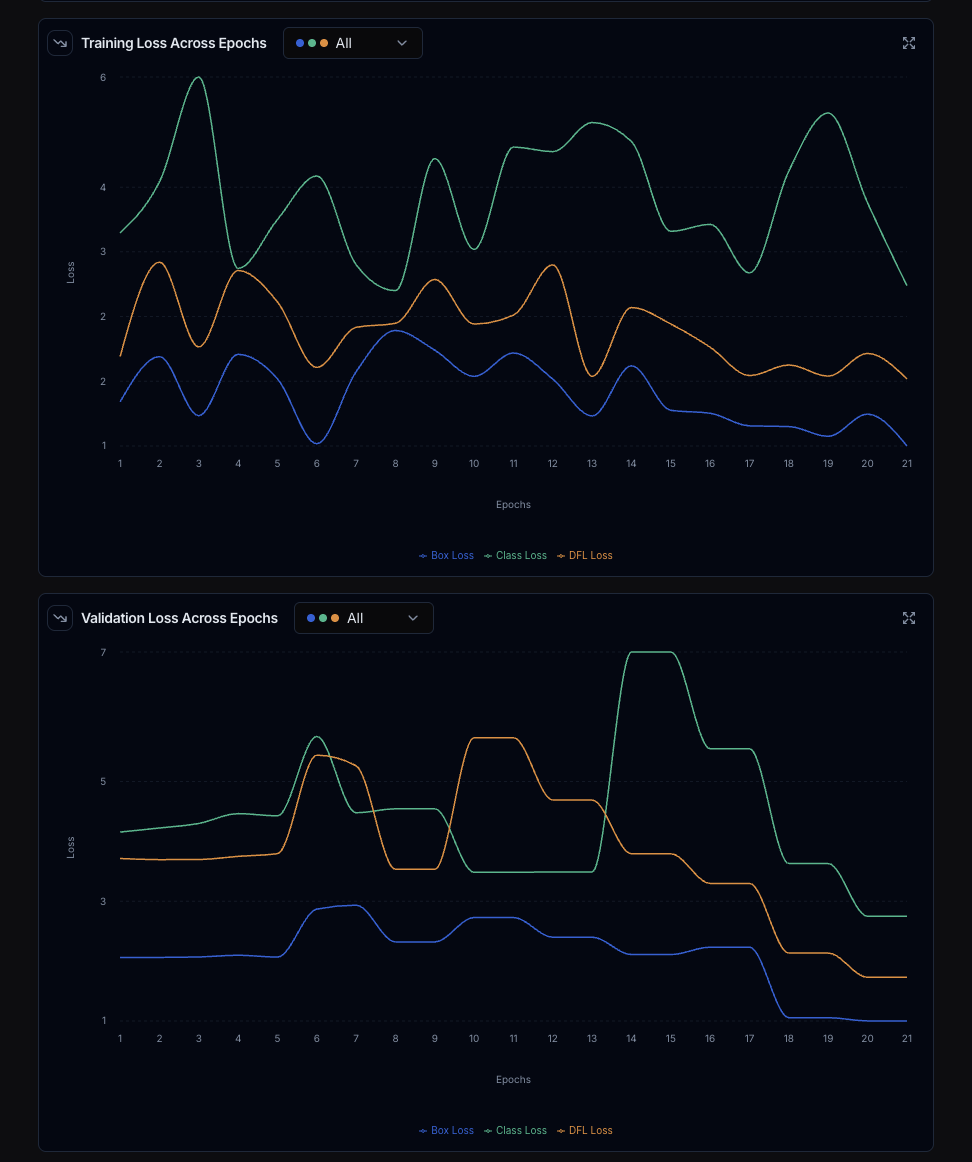 * **Training Loss** should trend downwards steadily.
* **Validation Loss** should track the training curve. If it diverges upward
your model is over-fitting.
## 3. Confusion Matrix
Rows = *actual* class, columns = *predicted* class. Diagonal cells are correct
predictions; off-diagonal cells highlight confusions.
* **Training Loss** should trend downwards steadily.
* **Validation Loss** should track the training curve. If it diverges upward
your model is over-fitting.
## 3. Confusion Matrix
Rows = *actual* class, columns = *predicted* class. Diagonal cells are correct
predictions; off-diagonal cells highlight confusions.
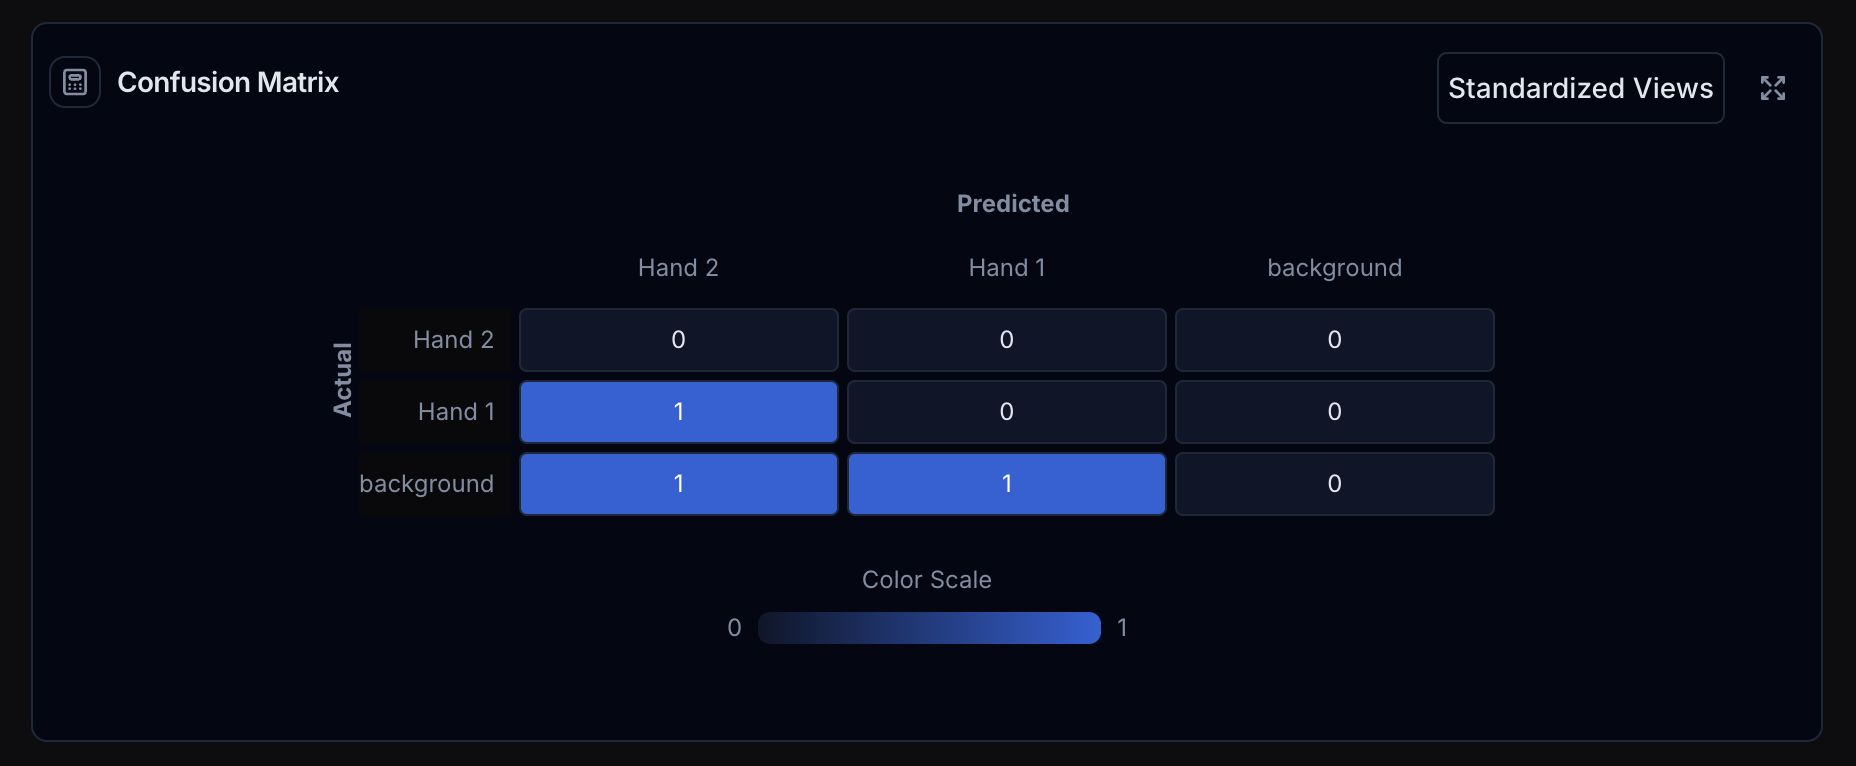 Hover a cell to reveal exact counts and click to view example frames in
context.
***
# 🛠️ Troubleshooting Checklist
| Symptom | Likely Cause | Remedy |
| ------------------------------------------- | ----------------------- | ---------------------------------------- |
| **Validation loss ↑ while training loss ↓** | Over-fitting | Add data, early-stop |
| **High precision, low recall** | Conservative confidence | Lower NMS-conf, larger model |
| **Low precision, high recall** | Noisy labels | Clean data, raise confidence |
| **Both low** | Model too small | Try `l` or `xl` variant, increase epochs |
## FAQ
**Why is mAP50 high but mAP50-95 low?**\
Boxes are in the right area but not tight. Try using more epochs.
**Why are there many background → class errors?**\
Add more pure background frames to train with
**When should I stop training?**\
When `val/mAP50` flattens or `Early-stopping` triggers after `patience` epochs.
***
Happy with the metrics? Download or deploy your model. Otherwise tweak settings
in the [Training page](/build-ai/model-training) and try again.
Hover a cell to reveal exact counts and click to view example frames in
context.
***
# 🛠️ Troubleshooting Checklist
| Symptom | Likely Cause | Remedy |
| ------------------------------------------- | ----------------------- | ---------------------------------------- |
| **Validation loss ↑ while training loss ↓** | Over-fitting | Add data, early-stop |
| **High precision, low recall** | Conservative confidence | Lower NMS-conf, larger model |
| **Low precision, high recall** | Noisy labels | Clean data, raise confidence |
| **Both low** | Model too small | Try `l` or `xl` variant, increase epochs |
## FAQ
**Why is mAP50 high but mAP50-95 low?**\
Boxes are in the right area but not tight. Try using more epochs.
**Why are there many background → class errors?**\
Add more pure background frames to train with
**When should I stop training?**\
When `val/mAP50` flattens or `Early-stopping` triggers after `patience` epochs.
***
Happy with the metrics? Download or deploy your model. Otherwise tweak settings
in the [Training page](/build-ai/model-training) and try again.